Claude, Copilot, and Dynamic Excel for Finance
Carl Seidman
FP&A Advisor | Microsoft MVP in Excel

Augment with AI the FP&A You Already Do, Without Handing Over the Judgment
If you work in FP&A, you already know the grind. The model you roll forward every month. The reporting package you reassemble by hand. The forecast that requires formula updates for hours. It requires great care and skill, but far too much of it is manual.
Meanwhile you keep hearing AI will change everything and that you're at risk of being left behind. But most of what you've seen is hype and hacks: slick demos that mesmerize, yet most people would never actually put in front of a CFO who calls their bluff.
I share that skepticism. Which is why this course is the opposite of that.
We take one company's core FP&A processes and we rebuild them. We explore the modeling, forecasting, reporting, and analysis that are standard. But then we evolve them into semi- and fully-automated workflows that free you up to do the higher-value work that actually matters. Step-by-step, we cover the real-life applications that can be immediately translated to your job.
You don't have to become an AI person. You become a faster, sharper version of the analyst and advisor you already are, without ever handing over the human judgment that makes you great at the job.
What you’ll learn
Turn the manual FP&A grind into automated, updatable workflows and become the analyst who makes AI actually work for the team.
Understand what Claude and Copilot each do well in Excel and finance, and where each one falls short.
Apply a simple decision rule for which tool fits a given modeling, reporting, or analysis task.
Stop chronically outsourcing and reaching for AI by reflex, and start using it only where it earns its place.
Draft, explain, and refactor Excel formulas with AI while keeping every step visible and verifiable.
Rebuild various sections of a real operating model faster and understand exactly what changed and why.
Use modern, dynamic Excel functionality where it makes a model more flexible, not more fragile.
Turn a manual monthly reporting rebuild into a process you trigger and review in a fraction of the time.
Design a forecast that updates instead of one you reconstruct from scratch every period.
Create reusable prompts, skills, and instructions so the work doesn't start from zero each month.
Build a near-hands-off refresh that carries raw data through to finished analysis and reporting.
Judge which parts of a workflow to fully automate and which to keep under deterministic human control.
Keep automated work auditable and explainable to anyone who reviews it.
Understand what an agent actually is, in plain finance terms and beyond the hype.
Set clear guardrails for where agentic work belongs in FP&A and where it doesn't.
Delegate a multi-step task end-to-end, then review the result against your own standards.
Assemble a full end-to-end workflow and run it on a real company's numbers.
Produce a board-ready narrative — the "so what" a CFO actually wants — from a semi-automated model.
Leave with a workflow and a plan you can apply to your own work the following week.
Learn directly from Carl

Carl Seidman
The person Fortune 500s use for their financial leadership development programs


Who this course is for
FP&A analysts, managers, and controllers who build the models, forecasts, and reports every month and are tired of the manual grind.
Finance leaders and doers who are accountable for the output, wanting sharper analysis and a faster team without trusting a black box.
Consultants, turnaround advisors, and PE professionals who model many workflows and need speed they can defend under a deadline.
What's included

Live sessions
Learn directly from Carl Seidman in a real-time, interactive format.
12-month access
Go back to course content and recordings whenever you need to.
Community of peers
Stay accountable and share insights with like-minded professionals.
Certificate of completion and CPE
Share your new skills with your employer or on LinkedIn. Receive a second certificate verifying your earning of CPE credits.
Contact us at:
info@seidmanfinancial.com
Maven Guarantee
Your purchase is backed by the Maven Guarantee.
Course syllabus
6 live sessions • 36 lessons
Week 1
Aug
17
Session 1: Claude, Copilot, and Dynamic Excel for FP&A
The Starting Line - Introduction to AI for FP&A
Week 2
Aug
24
Session 2: Claude, Copilot, and Dynamic Excel for FP&A
Deterministic Augmentation in AI Application
Schedule
Live sessions
2 hrs / week
Mon, Aug 17
4:00 PM—6:00 PM (UTC)
Mon, Aug 24
4:00 PM—6:00 PM (UTC)
Mon, Aug 31
4:00 PM—6:00 PM (UTC)
Async content
1-2 hrs / week
Testimonials
- I didn’t want to leave without thanking you for a great class. I loved it and leave with many helpful take-aways that I will work to develop and implement through our Finance and Accounting team. The materials were excellent as were your teaching and sharing. Lastly, thank you for the extra time you took with me. It made all the difference.

Mike Spauling
Private Equity Professional - Carl did a fantastic job. He was informative, engaging, humorous, and knowledgeable. I would definitely recommend his workshop to others.

Beth Broderick
Senior Research Analyst - I learned more in 2 days than I did in 3 accounting courses in college.

Joseph Schweihs
Program Manager - Thank you again for the great hands-on training experience in the past two days! Not only did we benefit from the introduction of some formulae that we may not be familiar with, you did a fantastic job showing us the multiple alternatives to produce the same results. Even for the formulae that I use frequently, you showed me new ways to use them.

Ai-Ning Wang
VP, Financial Planning & Analysis - Kept the class going in light of the subject. Fast-paced for an individual who has not had any exposure to finance and accounting but very good to bring together all aspects for managers that touch the finances.

Sandi Radtke
Human Resources Manager - Carl knows the material inside and out.

Gregory Samford
Senior Financial Analyst
Partial list of who I've worked with:

What attendees of Dynamic Excel for Finance have to say:
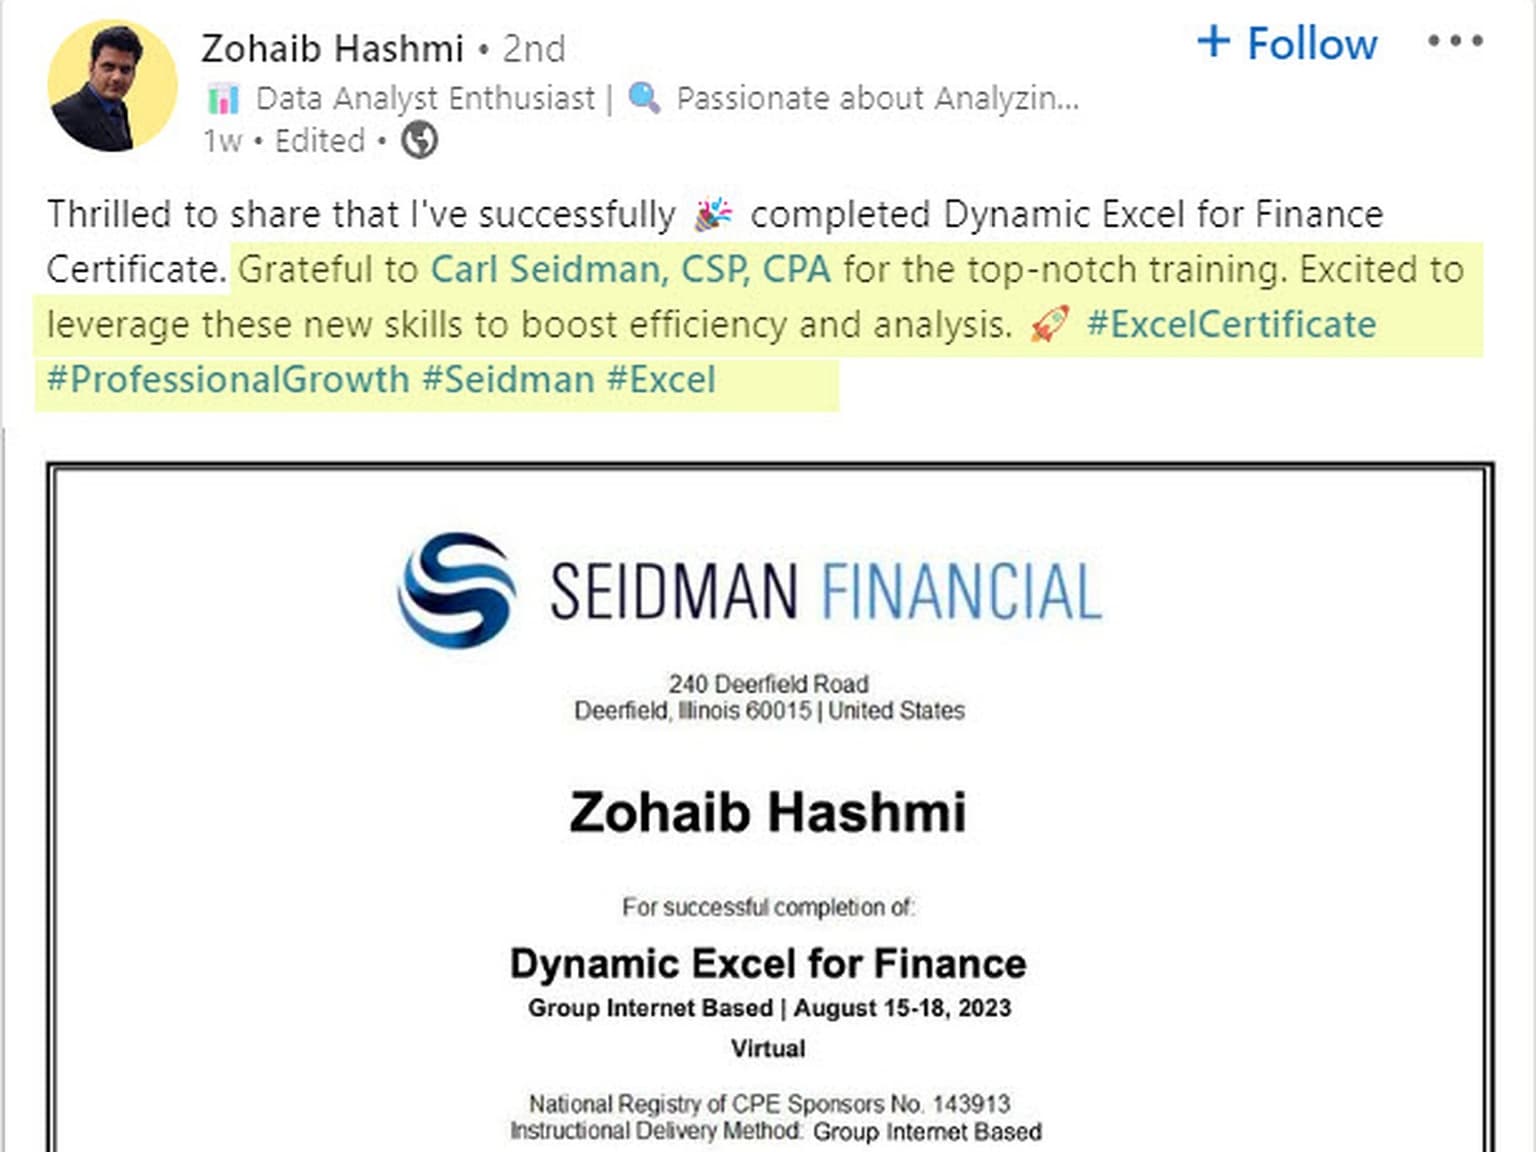
Source: Linkedin.com
Frequently asked questions
Here's what students have to say about the shortened 2.5-hour LinkedIn Learning version of Dynamic Excel for Financial Planning & Analysis.
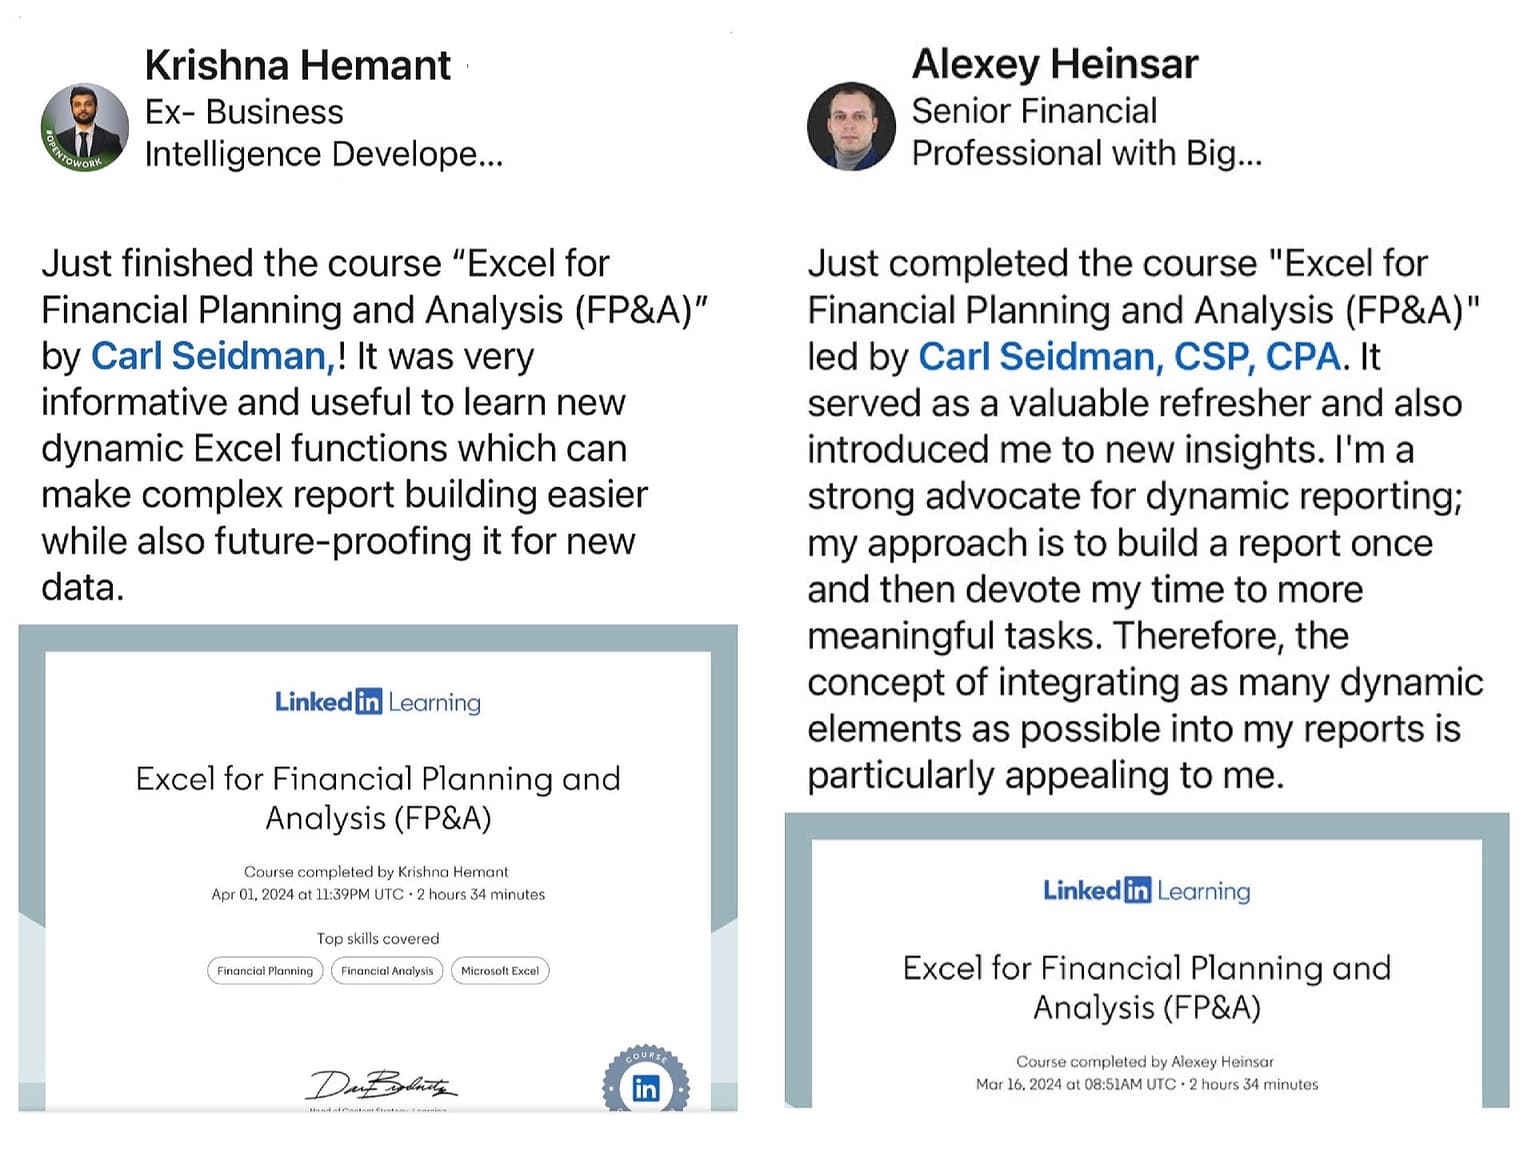
Source: LInkedIn
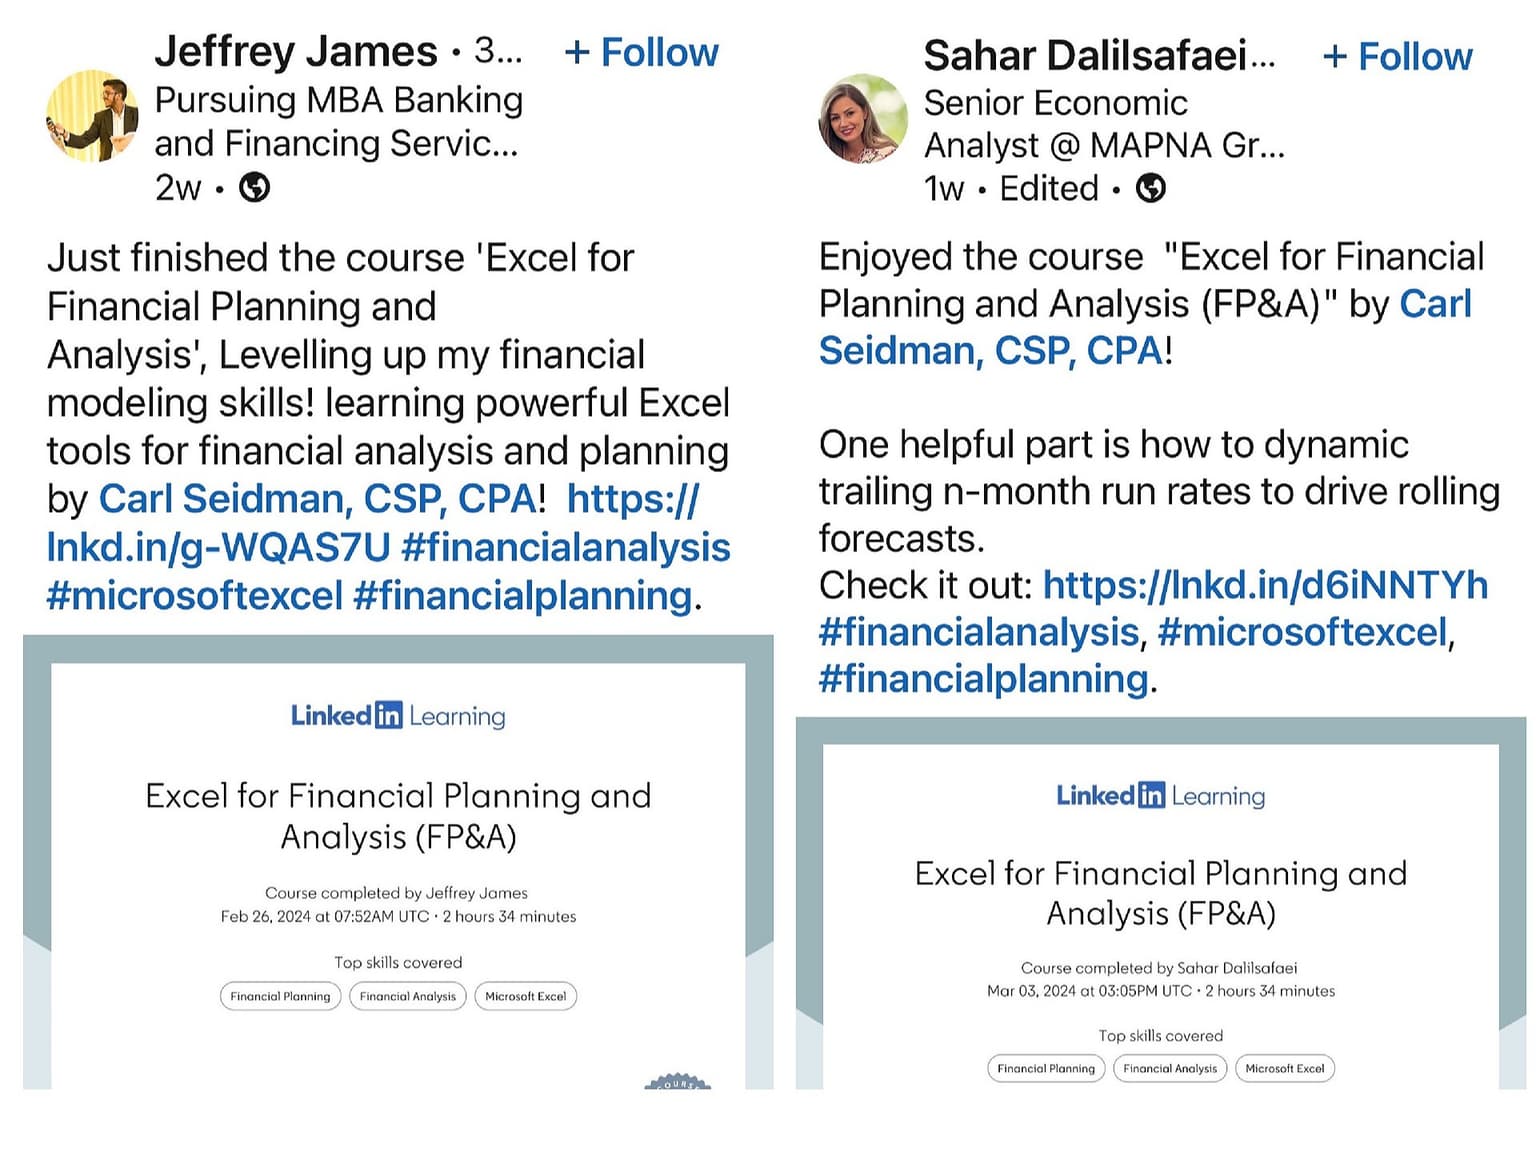
Source: LinkedIn
Maven for Teams
Reimbursement
Get your company to pay
Everything L&D needs: email template, receipts, and certificate of completion.
Get reimbursedTeam discount
Learn with your teammates
Save 20%+ when 2 or more teammates enroll in the same cohort.
Save 20%+ with a teamPrivate cohort
Run a cohort for your org
A dedicated cohort with a custom schedule and curriculum, tailored to your team.
Book a private cohort$1,100
USD