Rendering LiDAR and 3D Geodata
Abderrazzaq Kharroubi
PhD. Eng in 3D point clodus processing
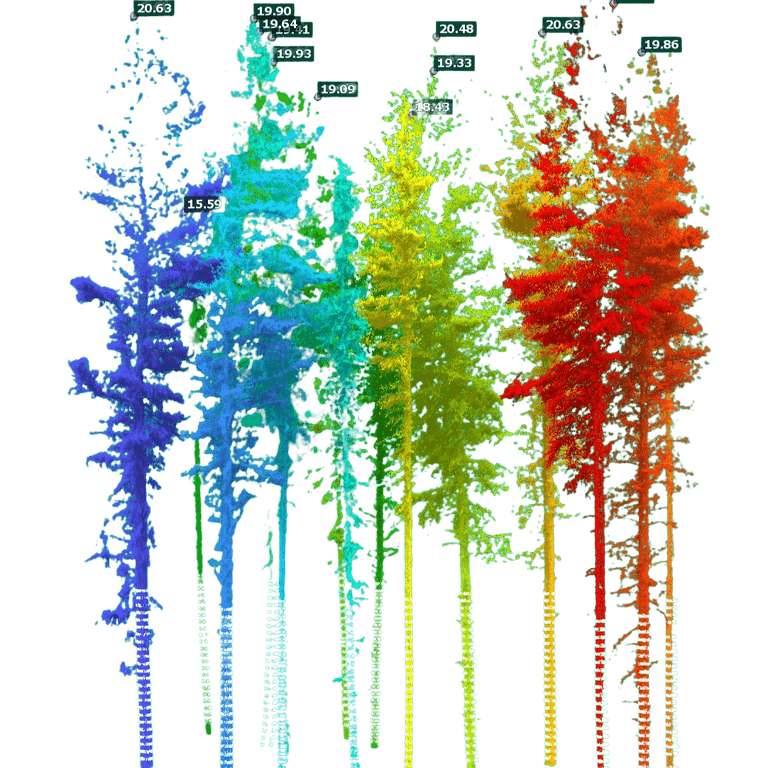
Make a point cloud look as good as the project behind it.
LiDAR and 3D city data are expensive to acquire, then often presented as flat, noisy screenshots. The problem is rarely the data. Points have no surface, no shading and no depth cue unless the rendering adds them, and default viewer settings do not.
This course covers the full pipeline, from preparing the data to producing a finished video: subsampling and normals, derived products (DTM, DSM, sky-view factor), lighting techniques that make geometry readable (splatting, Eye-Dome Lighting, sky-visibility shading), colour mapping, camera animation, and real-time GPU shaders for effects that standard tools cannot produce, such as geometry-driven colour transitions, voxelisation or city models rising from the points.
The methods apply whether you work in CloudCompare, OpenScanTools, Blender or your own code. You learn why each technique works, when to use it and how to set its parameters, so you can reproduce the results on your own data for reports, conferences, clients and publications.
What you’ll learn
You make nice renderings that sell.
Subsample to a homogeneous density, estimate and orient normals, separate ground, and compute derived products (DTM, DSM, nDSM, hillshade, s
Apply and tune point splatting, Eye-Dome Lighting and sky-visibility (PCV) shading, and know what each technique reveals and where it fails.
Normalise intensity, build elevation and height ramps, use class and change-detection palettes, and apply tone mapping, fog, bloom and depth
Plan shots and transitions, then produce fly-throughs in CloudCompare and OpenScanTools and terrain and city-model scenes in Blender.
Storyboard, titles, encoding and export formats for YouTube and LinkedIn, applied to your own dataset.
Learn directly from Abderrazzaq
Abderrazzaq Kharroubi
PhD in geomatics, contributor to research projects on 3D point clouds.

Who this course is for
Geomatics and surveying engineers who deliver point-cloud products and need to present them clearly to clients and non-specialists.
GIS analysts and digital-twin teams working with LiDAR, terrain and city models who need animations beyond default viewer output.
Researchers and PhD students who need figures and videos of 3D data for papers, conferences and project reviews.
What's included
Lifetime access
Go back to course content and recordings whenever you need to.
Community of peers
Stay accountable and share insights with like-minded professionals.
Certificate of completion
Share your new skills with your employer or on LinkedIn.
Maven Guarantee
Your purchase is backed by the Maven Guarantee.
You will be pround to showcasse your projects
Frequently asked questions
Maven for Teams
Reimbursement
Get your company to pay
Everything L&D needs: email template, receipts, and certificate of completion.
Get reimbursedPrivate cohort
Run a cohort for your org
A dedicated cohort with a custom schedule and curriculum, tailored to your team.
Book a private cohort