Data Storytelling for Startups
5 days
·Cohort-based Course
Learn how to tell a story with data and make it resonate with any audience.
Data Storytelling for Startups
5 days
·Cohort-based Course
Learn how to tell a story with data and make it resonate with any audience.
.png&w=1536&q=75)
Course overview
Data Storytelling for Startups
"No one ever made a decision because of a number. They need a story."
Who is this course for?
01
If you produce or present reports regularly and want to enhance how you communicate with data
02
If you come from a non-quantitative background, and want to skip all the math theory in data
03
If you work in Marketing, Customer Experience, Sales, or Product, and don't want to depend on others for analysis
Key outcomes
Turbocharge your communication with the power of data storytelling
- You will communicate in the form of beautiful and intuitive data visualizations and narratives as presentations or reports.
- You will provide actionable recommendations based on data insights that address the needs of your stakeholders.
Carry out simple but powerful analytics for data-driven insights
- You will use benchmarking, segmentation, and funnel analysis to dig into the data relevant for teams in HR, marketing, product, or sales.
- You will apply frameworks that help to derive insights with tangible business value from complex datasets and analyses.
Translate from business needs to data and back
- You will enhance your credibility by mastering concepts including statistical bias, confounding variables, and dataset limitations and translating them into business terms for stakeholders.

Marketing Teams
How might we visualize our AARRR funnel and optimize metrics?
Customer Experience Teams
How might we breakdown customer feedback and improve service efficiency?
Product Teams
How might we drive user retention?
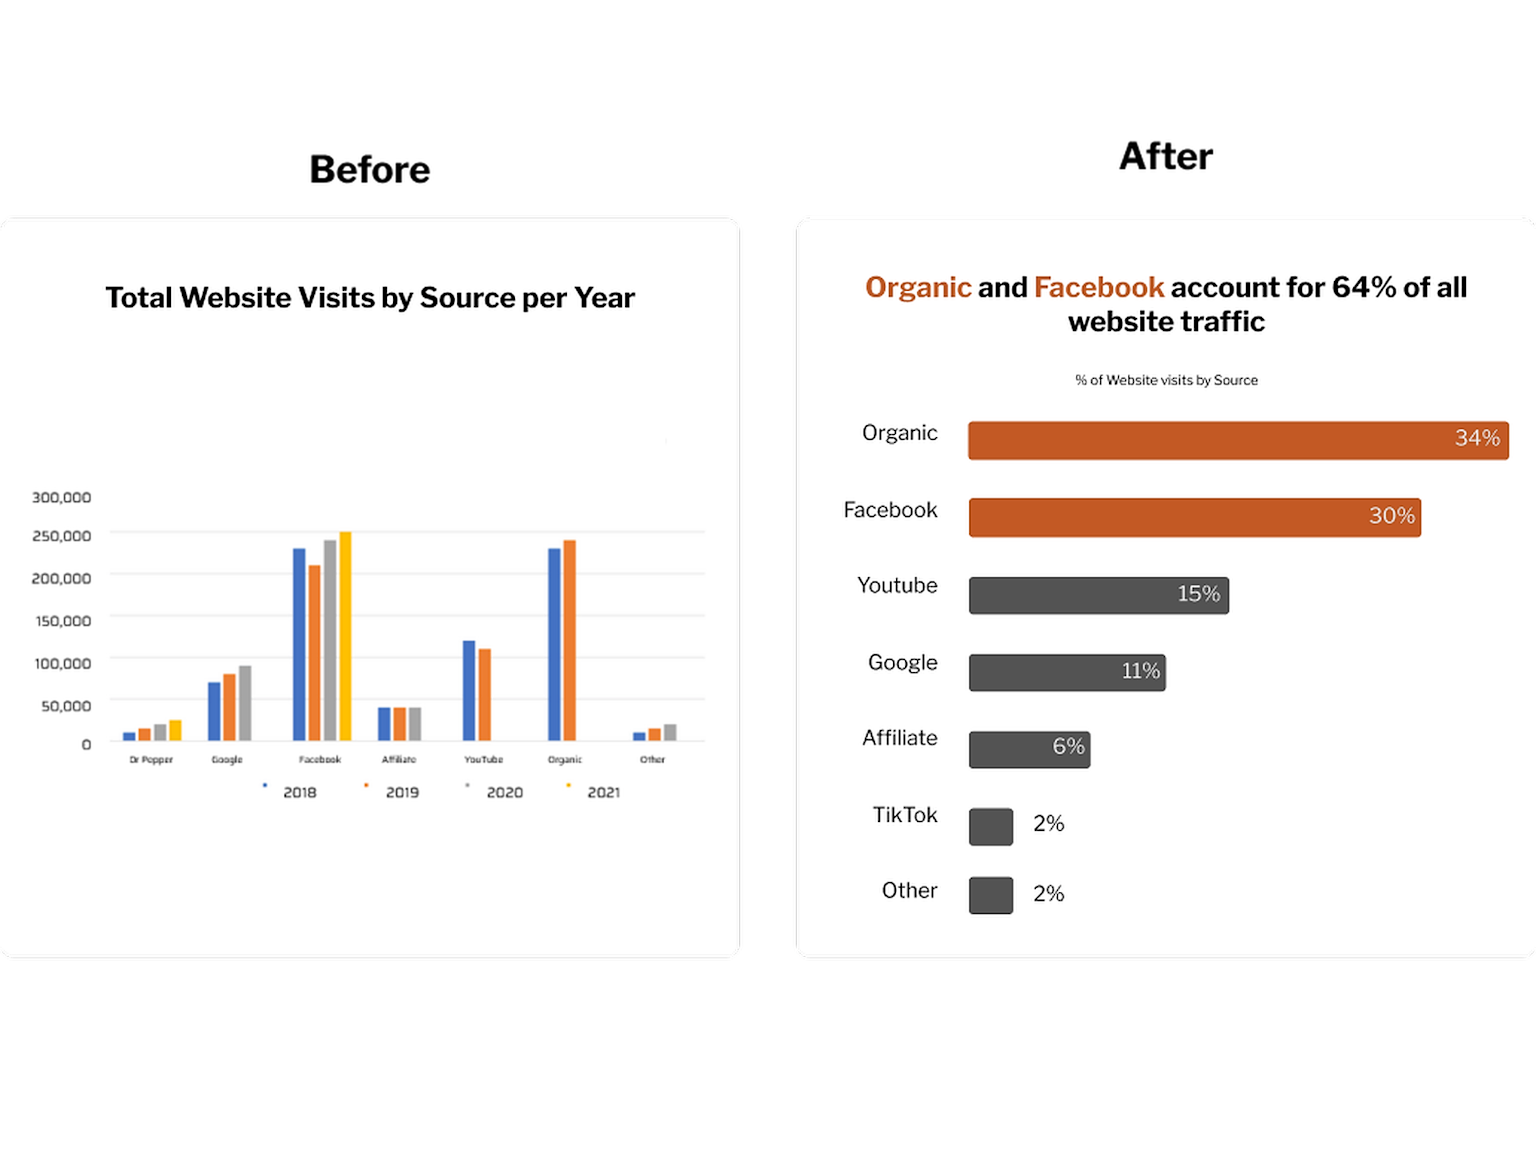
Elevate Messy Data into Beautiful Insights
Drive Business Impact
Strategize faster with quick turn around of insight generation without getting your data team involved and wow your colleagues with beautiful presentations.
See what people are saying

Jay Caluag

Be the first to know about upcoming cohorts
Data Storytelling for Startups
Meet your instructor
Aurélien Chu
Aurélien Chu
Co-Founder, COO of Eskwelabs
Aurélien oversees the educational experiences at Eskwelabs. He is passionate about advancing understanding of decision science, bringing together advanced data skills and business strategy frameworks to unearth novel insights.
Be the first to know about upcoming cohorts
Data Storytelling for Startups
Course schedule
3 Sessions / 6 Hours
Session 1: October 3
5:00 pm - 7:00 pm (Pacific Time)
Session 2: October 5
5:00 pm - 7:00 pm (Pacific Time)
Session 3: October 7
5:00 pm - 7:00 pm (Pacific Time)
Course syllabus
Be the first to know about upcoming cohorts
Data Storytelling for Startups
Frequently Asked Questions
Be the first to know about upcoming cohorts